Evidence shows that pet owners are spending more on products and services for their furry family members. That purchasing power is also having an impact on the travel industry. More accommodations are catering to pet travelers, and cities are touting their pet friendly activities in hopes of drawing more visitors. So, are pet lovers really interested in traveling with their pets? We asked our readers in our pet travel survey 2018, and this is what they had to say:
2018 Pet Travel Survey
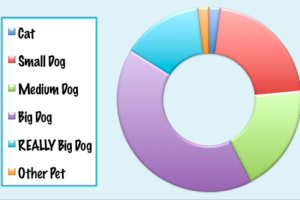
What types of pets do you have?
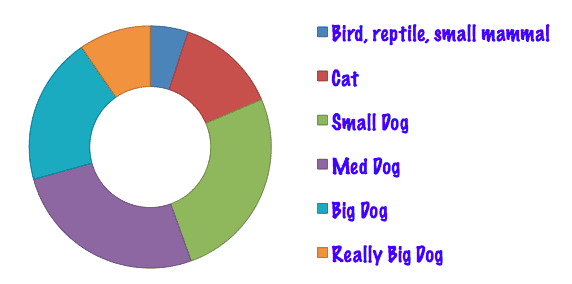
Laying the foundation, we determined what pets share our readers’ homes. We learned that 5.1% have one or more birds, reptiles, or small mammals, 13.5% have one or more cats, 25.9% have one or more small dogs (less than 20 pounds), 26.2% have one or more medium dogs (21 – 50 pounds), 19.7% have one or more big dogs (51 – 80 pounds), and 9.6% have one or more very large dogs (more than 80 pounds).
In addition to your pets, do you travel with children under the age of 15?
We found that an overwhelming 95.4% of our readers are not traveling with children.
In the past year, how often have your pets accompanied you for a ride in a vehicle?
To get a feel for how much pets are getting out, we asked how often they accompany our readers in the vehicle. The answers were exciting! Just 0.8% of respondents said they never take their pet in a vehicle, 6.7% said their pets go along less than once a month, 12.5% said about once a month, 25.4% said two to five times per month, and a whopping 54.6% said their pet goes for a ride more than six times a month!
When your pets travel in your vehicle, how are they restrained?
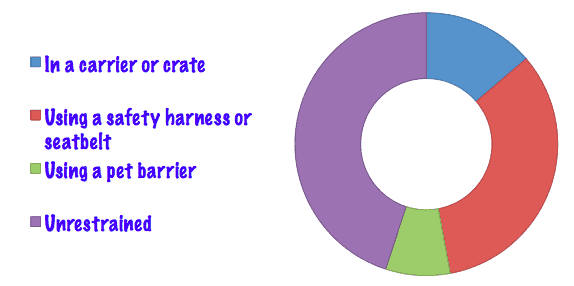
We’re firm believers that safely comes first, so we were happy to see that 13.8% of pets are enclosed in a secured carrier or crate in the car, 33.3% use a safety harness or seat belt, and 7.9% rely on a pet barrier. What’s distressing is that 45.0% of respondents said their pets are unrestrained in the car!
Digging a little deeper, we discovered that the most common reason people sited for not buckling up their pet is that they hadn’t thought of it. Hopefully, they’ve pondered it a bit and concluded that the most important part of pet travel is making sure you all come home together safely.
What types of vacations do you most enjoy with your pets?
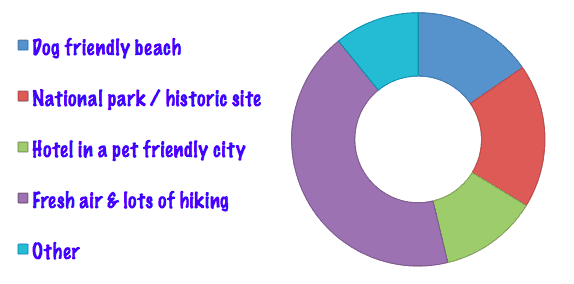
Understanding where our readers like to spend their vacation time will help us determine where we should focus our “paws-on-the-ground” research. We were interested to find out that 15.4% prefer going to a dog friendly beach, 18.3% want to check out a national park or historic site, 12.5% opt for a hotel in a pet friendly city, 42.9% look for a destination with fresh air and lots of hiking, and 10.8% choose other types of vacations.
READ MORE ⇒ The Ultimate Pet Friendly American Road Trip
How many pet-friendly overnight trips are you planning to take this year?
Learning how many overnight trips respondents are planing indicates how excited people are to travel with their pets. The results of our survey showed that just 4.6% are not planning any overnights with their pets. Pets will be happy to learn that 27.5% are planning at one or two trips, 36.7% are planning three to five getaways, and 31.3% plan to travel with their pet six or more times this year!
Which mode of transportation is your family most likely to use?
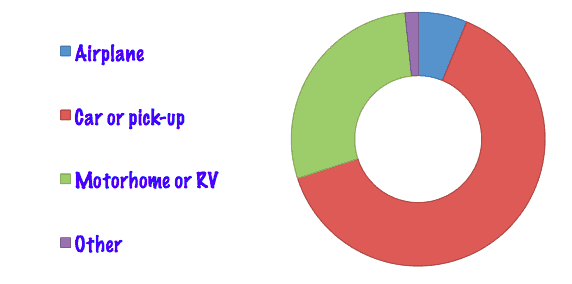
As we anticipated, the majority of respondents, 63.8%, travel by car or pick-up. The second most popular chose is traveling by motorhome or RV at 28.3%. Flying appeals to 6.3% of our readers, and 1.7% choose a different mode of transportation.
What type of pet-friendly accommodations are you most likely to book?
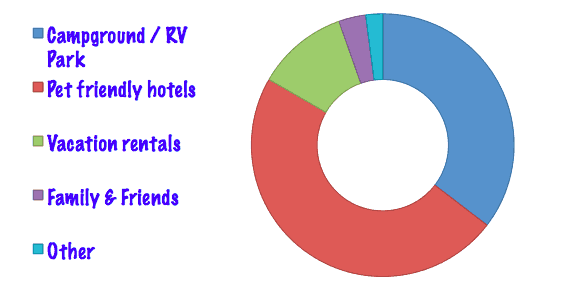
With all the alternatives out there, 35.4% of our readers opt for campgrounds or RV parks. The next most popular choice at 47.9% is to stay at pet friendly hotels. The remainder choose vacation rentals (11.3%), bunk with friends or family (3.3%), and arrange other accommodations (2.1%).
What is your biggest concern when traveling without your pets?
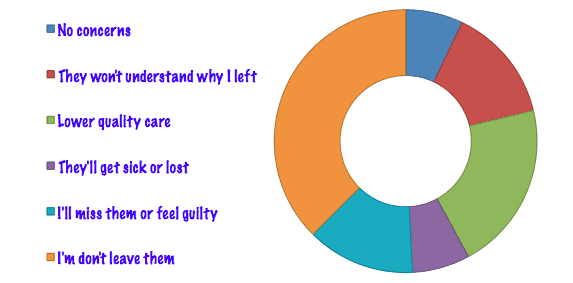
Leaving our pets behind can be difficult. Only 7.1% of respondents said they had no concerns when traveling without their pets. For 14.2%, their biggest worry is their pets will miss them or not understand why they left. Another 20.8% said they’re concerned that the care their pets receive won’t be the same quality they’d provide, and 7.1% worried their pet would get sick or lost. Another 13.3% believed they’d miss their pets too much or feel too guilty to enjoy their trip. And 37.5% simply decided that won’t travel without their pets.
Thanks to everyone who took the time to fill out our pet travel survey. We wish you all fantastic travels!
Amazon Affiliate Disclosure: GoPetFriendly.com LLC is a participant in the Amazon Services LLC Associates Program, an affiliate advertising program designed to provide a means for website owners to earn advertising fees by advertising and linking to amazon.com, audible.com, and any other website that may be affiliated with Amazon Service LLC Associates Program. As an Amazon Associate, the owner of this site earns a commission from qualifying purchases.







hello, how many respondents participated in the survey? Thanks.
Hi Juliette! If I remember correctly, it was around 750.
Be well!
You list campgrounds as #1 choice (35.4%) then pet-friendly hotels (47.9%) when it comes to accommodations. Which one is actually first and second. Thanks!
Thanks for point that out, Sandy.
Hello! Thank you for this article! May I ask how many people took the survey?
Hello! We had 748 responses to the survey.